This page describes how to analyze fluorescence intensity (ΔF/F₀) from a series of images using ImageJ and Excel. While semi-automated custom tools are often used to facilitate rapid analysis of fluorescence data, there is great value in understanding how to realize these analyses using standard and commonly-available software.
Measure ROI Fluorescence
- Install ImageJ (Fiji)
- Drag/drop a folder of images onto ImageJ to open all images as a stack
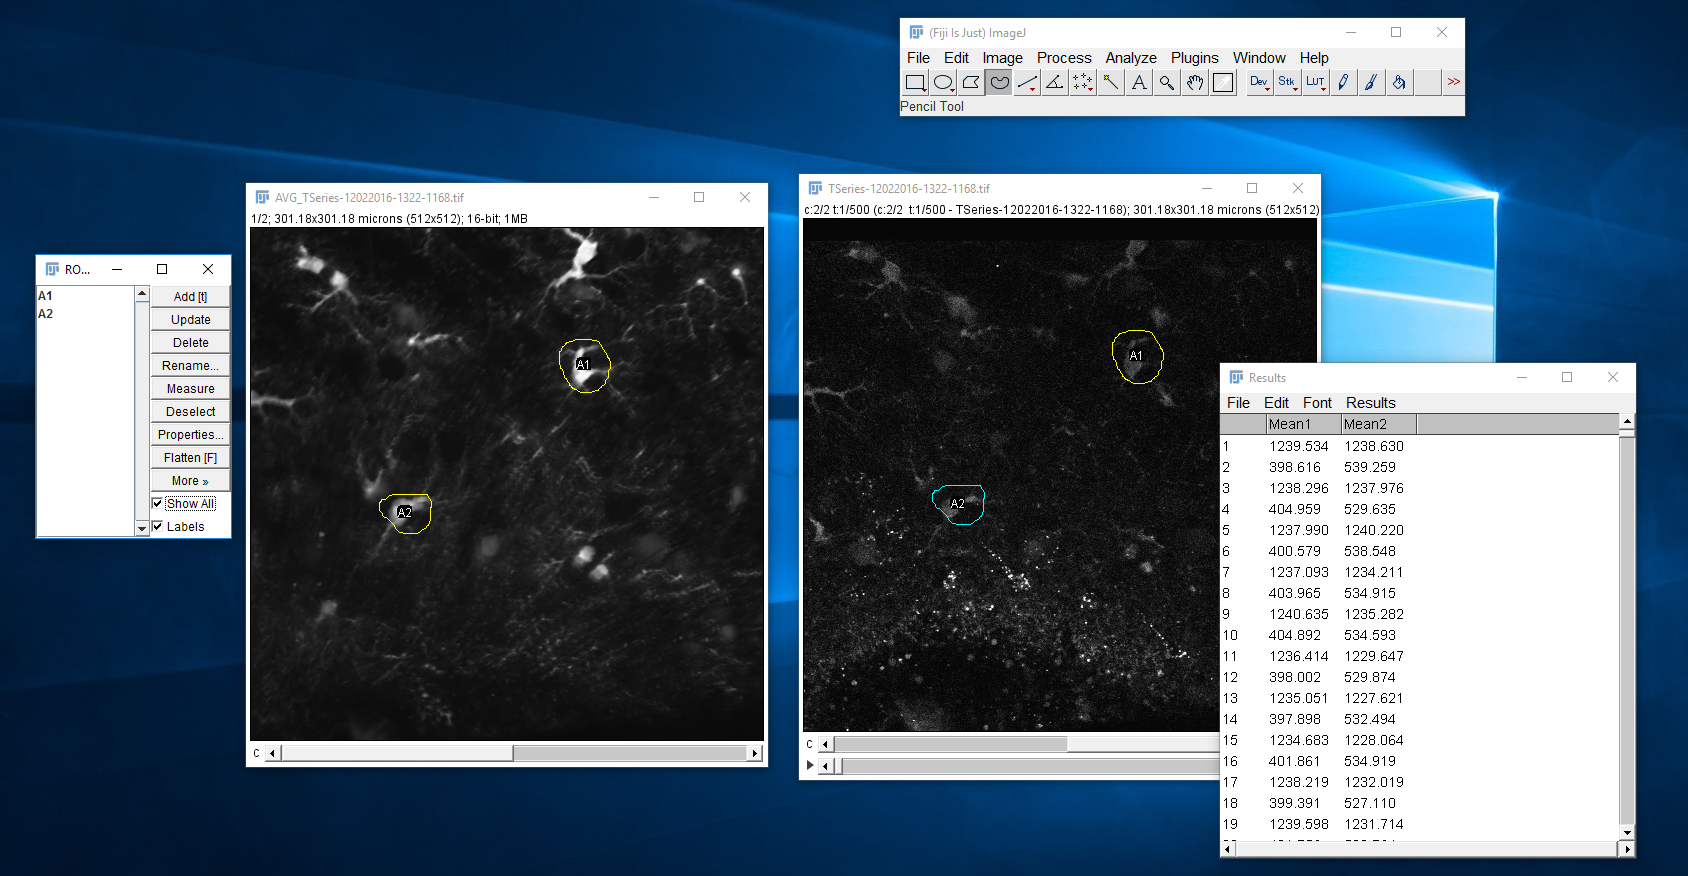
- Create a maximum projection (of either channel) to make drawing of ROIs easy. Image > Stack > Z project and select Average (not maximum projection!)
- do all ROI creation on the projection. You can later use these same ROIs on the original data.
- Click analyze > tools > ROI manager (ROI means “region of interest”)
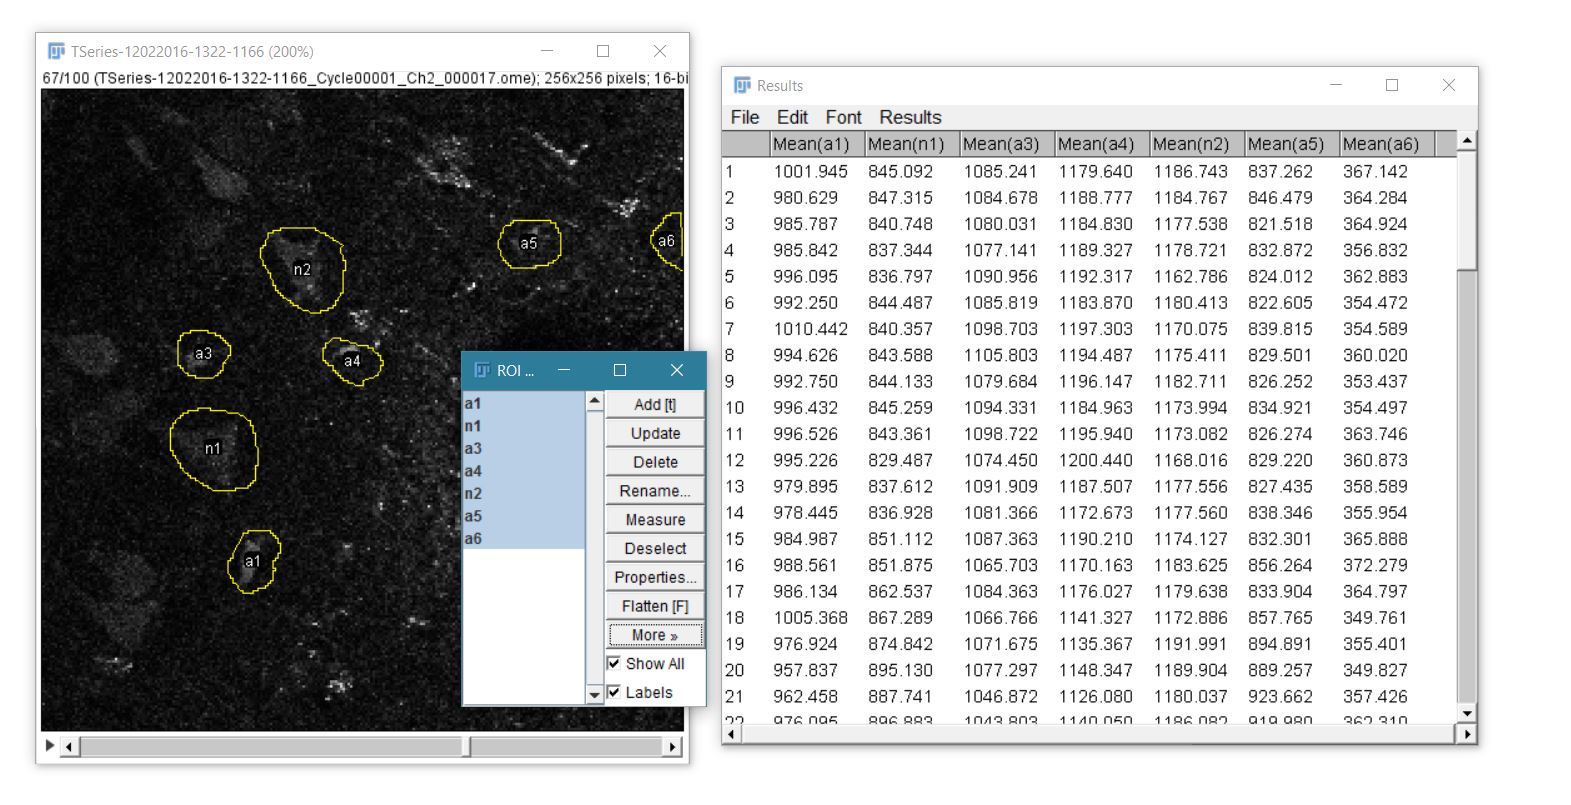
- Use the “freehand sections” tool (as opposed to the square or circle) to outline some cells.
- Every time you outline a cell, click the add button on the ROI manager.
- I recommend naming cells as you add them (click the rename button).
- Be sure to indicate whether the thing is a neuron or astrocyte.
- When all cells have been outlined, highlight them all (with shift-click or control-click) and save the ROIs by clicking more > save.
- once ROIs have been saved, you can load the same ROIs on the red stack, green stack, or a projection image
- Deterime what data to analze by clicking analyze > set measurements
- I recommend selecting ONLY “Mean gray value”
- Analyze the data in the ROI manager by clicking more > multi measure
- In the results window, click file > save as and call it something
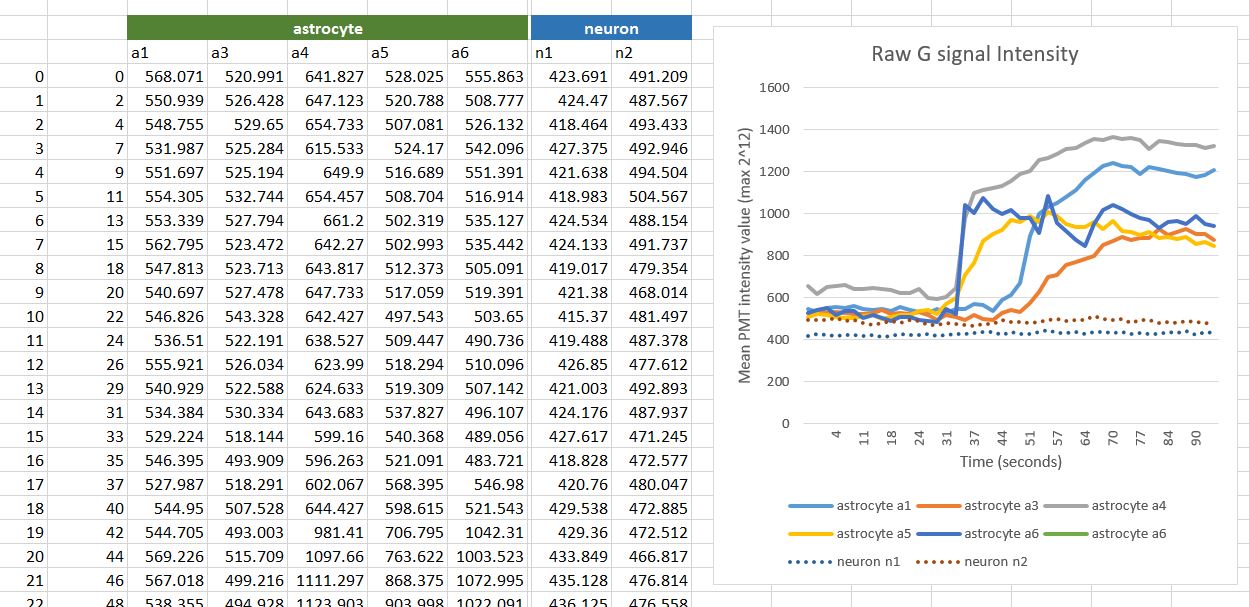
- Excel 2016 may not be able to open the .xls file. You may have to rename it to .tsv (short for tab-separated values) and drag/drop it into a blank excel worksheet.
- Once the data is in excel, add a “time” column and populate its values appropriately
Calculate Single-Channel ΔF/F₀
Single-channel fluorescence experiments report the change in fluorescence (ΔF) normalized to its baseline level (F₀). In this example F is measured for each ROI in every frame. The following steps are performed for each ROI.
-
Calculate
F₀as the mean fluorescence intensity during the baseline region -
Calculate
ΔFby subtractingF₀from everyFvalue -
Calculate
ΔF/F₀by dividingΔFvalues byF₀
Calculate Ratiometric ΔF/F
The following describes how to measure ratiometric fluorescence from a series of 2D multi-channel images. See Ratiometric Linescan Analysis with ImageJ and Excel for information specific to analyzing ratiometric linescan images.
Two-channel fluorescence experiments report ΔF/F as the change in one fluorophore relative to another. In this example we will use G to represent a calcium-sensitive fluorophore and report the change in its fluorescence relative to a calcium-insensitive fluorophore R. In this example G/R is measured for each ROI in every time point. The following steps are performed for each ROI.
In this case F represents G/R so ΔF/F is: [Δ(G/R)]/(G/R)₀
-
Calculate
(G/R)₀as the mean ratio of fluorescence intensity during the baseline region -
Calculate
Δ(G/R)by subtracting(G/R)₀from every(G/R)value -
Calculate
ΔF/Fby dividingΔ(G/R)values by(G/R)₀