This page describes how to analyze fluorescence intensity (ΔF/F₀) from a ratiometric linescan using ImageJ (Fiji) and Excel. While semi-automated custom tools are often used to facilitate rapid analysis of fluorescence data, there is great value in understanding how to realize these analyses using standard and commonly-available software.
Measure Fluorescence with ImageJ
- Rotate images so time proceeds horizontally from left to right.
- If original data is vertical (time proceeds top to bottom),
Image>Transform>Rotate 90 Degrees to Left
- If original data is vertical (time proceeds top to bottom),
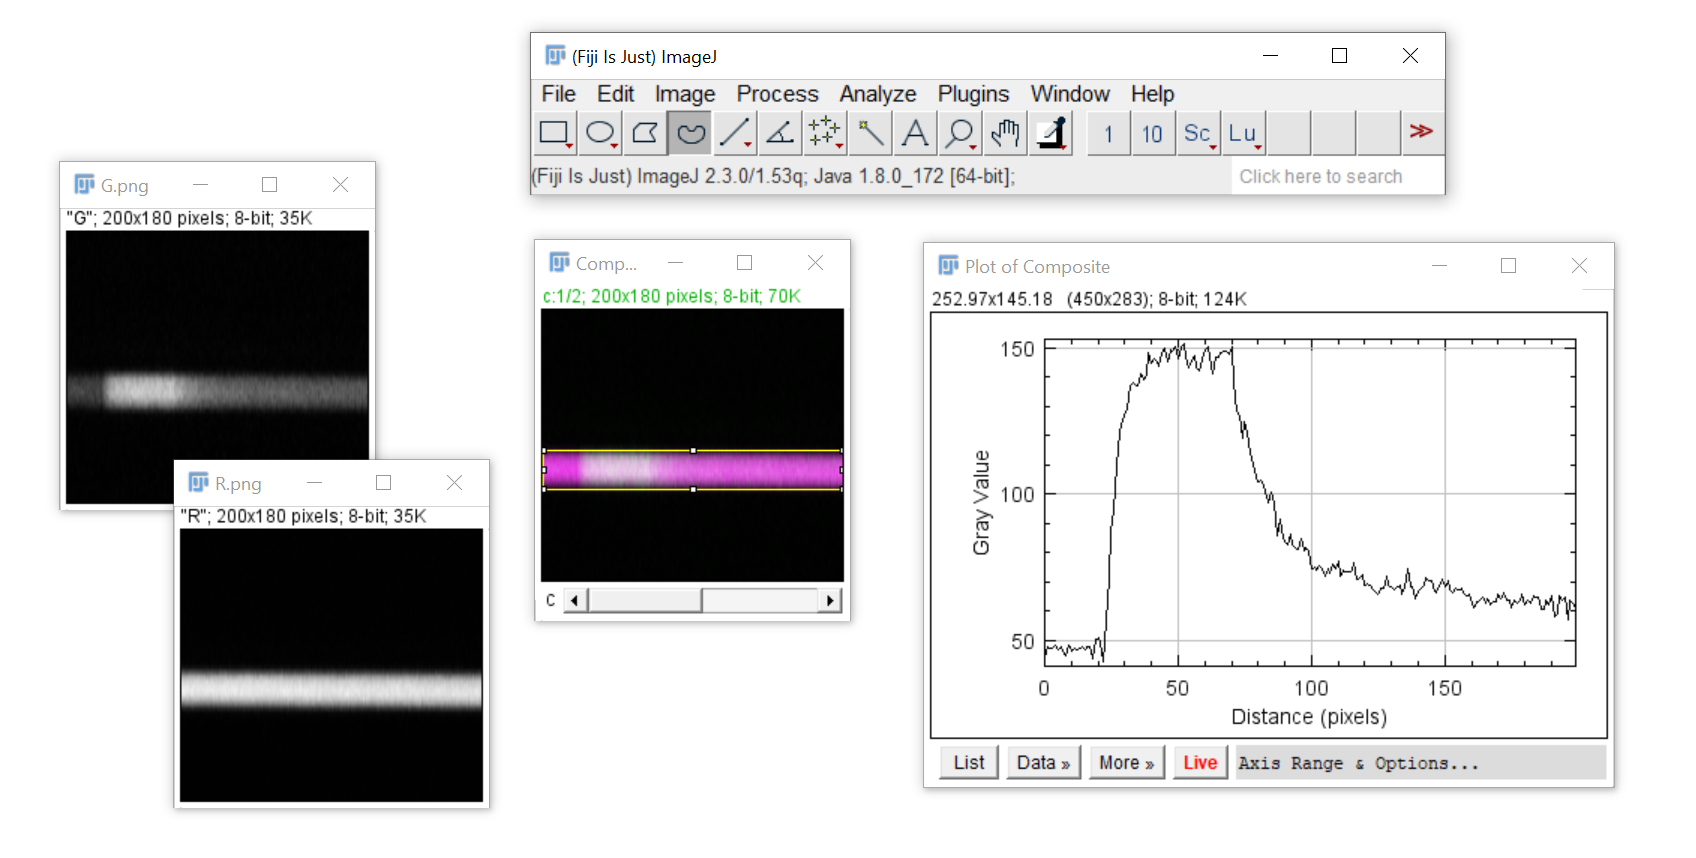
- Merge
GandRinto a composite image- Click
Image>Color>Merge Channels - I recommend making the red channel magenta rather than red
- Click
- Draw a ROI around the structure of interest in the composite image
- Click
Analyzeand selectPlot Profile - Click
Liveand notice the curve change as you change channels using the scrollbar in the composite image - For each channel, click
Data, selectCopy All Data, and paste the result in Excel - The first column (pixel number) should be replaced by times
💡 The amount of black space captured by the ROI only slightly affects the resulting ΔF/F because fluorescence intensity in each channel is summed before taking the ratio. Note that mean ROI intensity is just the sum divided by a fixed area. Summing fluorescence from extra blank space does not affect the result beyond contributions from noise and basal fluorescence.
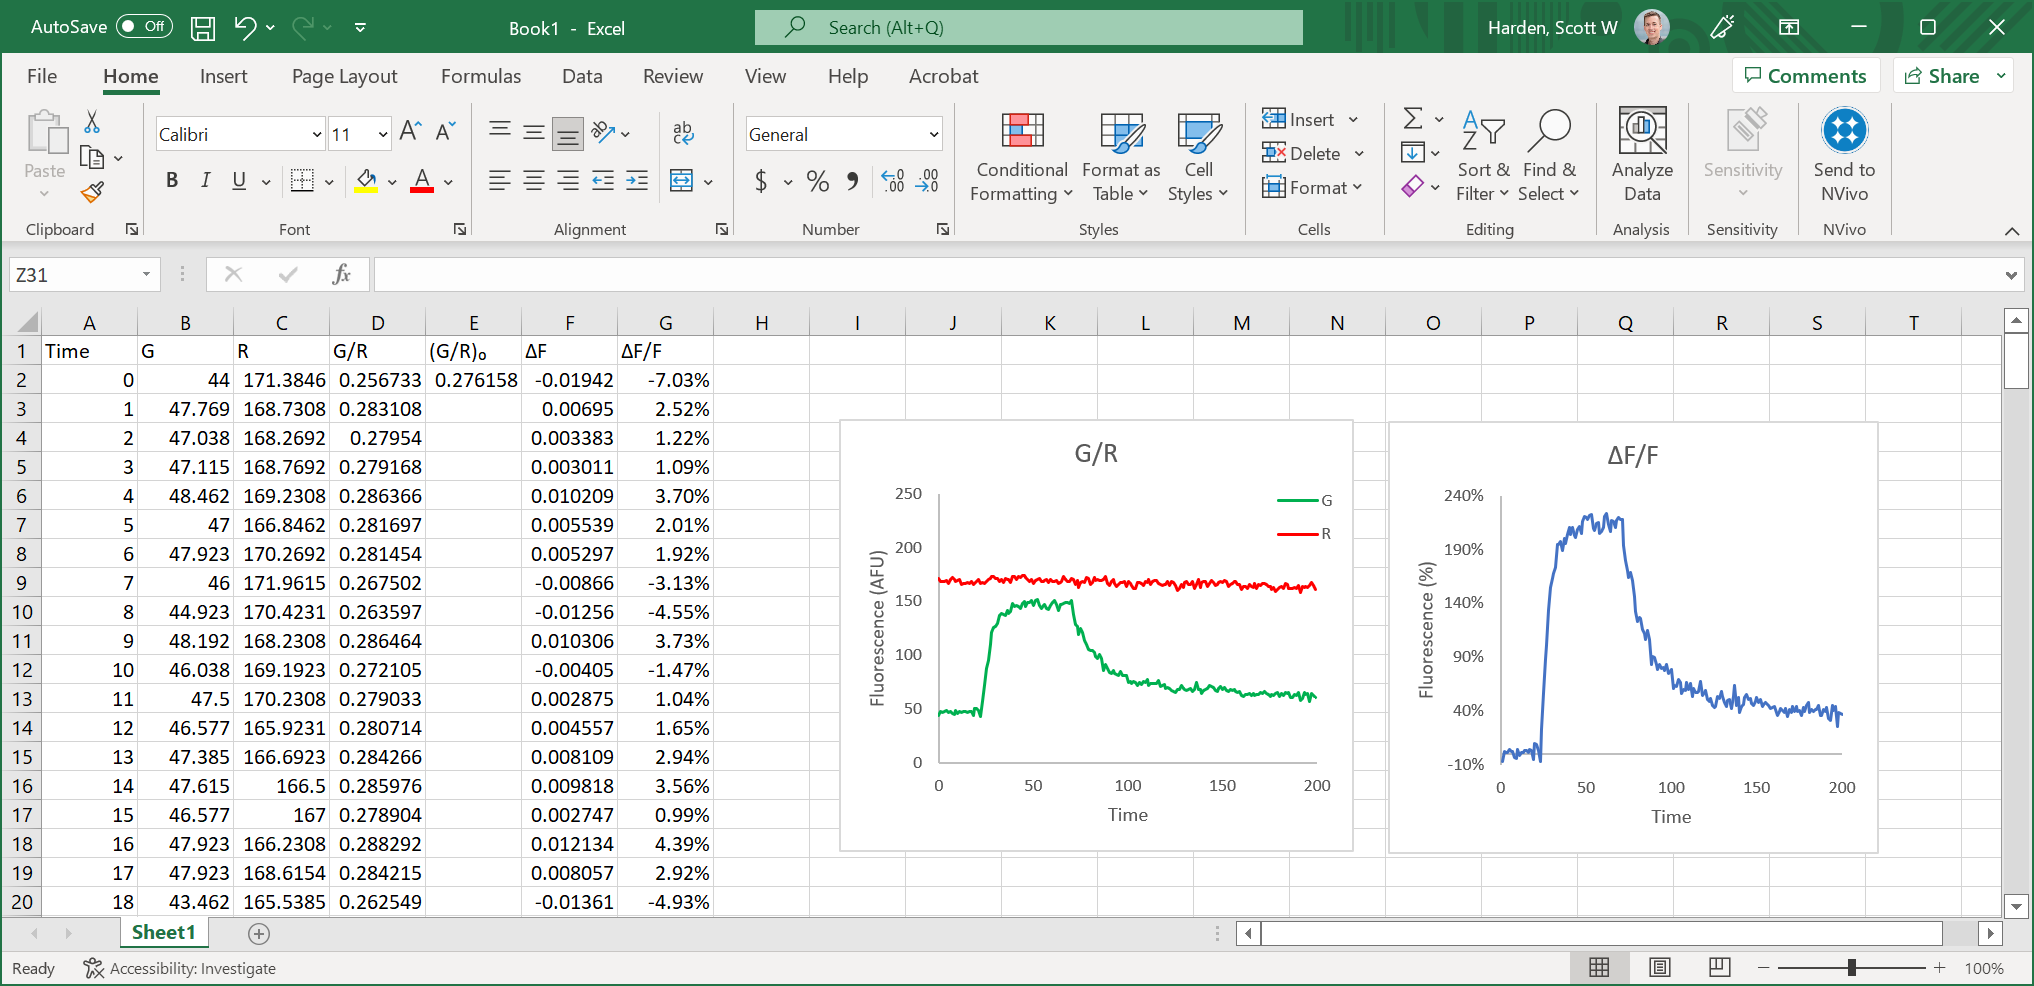
Calculate Ratiometric ΔF/F with Excel
Two-channel fluorescence experiments report ΔF/F as the change in one fluorophore relative to another. In this example we will use G to represent a calcium-sensitive fluorophore and report the change in its fluorescence relative to a calcium-insensitive fluorophore R. In this example G/R is measured for each ROI in every time point. The following steps are performed for each ROI.
In this case F represents G/R so ΔF/F is: [Δ(G/R)]/(G/R)₀
-
Calculate
(G/R)₀as the mean ratio of fluorescence intensity during the baseline region -
Calculate
Δ(G/R)by subtracting(G/R)₀from every(G/R)value -
Calculate
ΔF/Fby dividingΔ(G/R)values by(G/R)₀
Sample Data
This excel file: linescan.xlsx
Images analyzed:
| Green | Red |
|---|---|
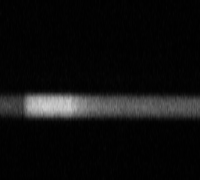 |
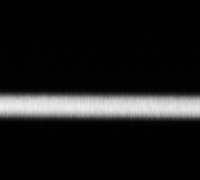 |
Resources
-
ROI Analysis Pipeline (GitHub) is a collection of software tools for analyzing fluorescence images
-
ScanAGator (GitHub) is a tool that facilitates analysis of ΔF/F from ratiometric linescan images